12.Cloud Monitoring
Index
- Intro
- Cloud-watch
- Cloud-watch log
- Cloud-watch event
- Event Bridge
- Cloud Trail
- Cloud trail insight
- AWS XRays
- Amazon Code-guru Reviewer
- Amazon Code-guru Profiler
- AWS serviced health Dashboard
- AWS personal health dashboard
- CloudWatch provides metrics for every services in AWS
- Metric is a variable to monitor (CPUUtilization, NetworkIn…)
- Metrics have timestamps
- Can create CloudWatch dashboards of metrics
Important Metrics for cloud watch
- EC2 instances: CPU Utilization, Status Checks, Network (not RAM)
- Default metrics every 5 minutes
- Option for Detailed Monitoring ($$$): metrics every 1 minute
- EBS volumes: Disk Read/Writes
- S3 buckets: BucketSizeBytes, NumberOfObjects, AllRequests
- Billing: Total Estimated Charge (only in us-east-1)
- Service Limits: how much you’ve been using a service API
- Custom metrics: push your own metrics
Amazon CloudWatch Alarms
- • Alarms are used to trigger notifications for any metric
- • Alarms actions…
- • Auto Scaling: increase or decrease EC2 instances “desired” count
- • EC2 Actions: stop, terminate, reboot or recover an EC2 instance
- • SNS notifications: send a notification into an SNS topic
- • Various options (sampling, %, max, min, etc…)
- • Can choose the period on which to evaluate an alarm
- • Example: create a billing alarm on the CloudWatch Billing metric
- • Alarm States: OK. INSUFFICIENT_DATA, ALARM
Amazon CloudWatch Logs
- CloudWatch Logs can collect log from:
- Elastic Beanstalk: collection of logs from application
- ECS: collection from containers
- AWS Lambda: collection from function logs
- CloudTrail based on filter
- CloudWatch log agents: on EC2 machines or on-premises servers
- Route53: Log DNS queries
• Enables real-time monitoring of logs
• Adjustable CloudWatch Logs retention
CloudWatch Logs for EC2
- By default, no logs from your EC2 instance will go to CloudWatch
- You need to run a CloudWatch agent on EC2 to push the log files you want
- Make sure IAM permissions are correct
- The CloudWatch log agent can be setup on-premises too
Amazon CloudWatch Events
This service allows customers to consume a near real-time stream of events as changes to their AWS environment take place.
- Schedule: Cron jobs (scheduled scripts)
- Event Pattern: Event rules to react to a service doing something
- Trigger Lambda functions, send SQS/SNS messages…
Amazon EventBridge
EventBridge was formerly called Amazon CloudWatch Events. … EventBridge uses the same CloudWatch Events API, so all of your existing CloudWatch
3 Types of source of event – Default event bus,Partner,custom
- EventBridge is the next evolution of CloudWatch Events
- Default event bus: generated by AWS services (CloudWatch Events)
- Partner event bus: receive events from SaaS service or applications(Zendesk, DataDog, Segment, Auth0…)
- Custom Event buses: for your own applications
- Schema Registry: model event schema
- EventBridge has a different name to mark the new capabilities
- The CloudWatch Events name will be replaced with EventBridge
AWS CloudTrail
- Provides governance, compliance and audit for your AWS Account
- CloudTrail is enabled by default!
- Get an history of events / API calls made within your AWS Account by:
- Console
- SDK
- CLI
- AWS Services
- Can put logs from CloudTrail into CloudWatch Logs or S3
- A trail can be applied to All Regions (default) or a single Region.
- If a resource is deleted in AWS, investigate CloudTrail first!
CloudTrail Events – 3 types -Maangement/Data/Insight Event
- Management Events:
- Operations that are performed on resources in your AWS account
- Examples:
- Configuring security (IAM AttachRolePolicy)
- Configuring rules for routing data (Amazon EC2 CreateSubnet)
- Setting up logging (AWS CloudTrail CreateTrail)
- By default, trails are configured to log management events.
- Can separate Read Events (that don’t modify resources) from Write Events (that may modify resources)
- Data Events:
- By default, data events are not logged (because high volume operations)
- Amazon S3 object-level activity (ex: GetObject, DeleteObject, PutObject): can separate Read and Write Events
- AWS Lambda function execution activity (the Invoke API)
CloudTrail Insights – insight into unusual activity
- • Enable CloudTrail Insights to detect unusual activity in your account:
- • inaccurate resource provisioning
- • hitting service limits
- • Bursts of AWS IAM actions
- • Gaps in periodic maintenance activity
- • CloudTrail Insights analyzes normal management events to create a baseline
- • And then continuously analyzes write events to detect unusual patterns
- • Anomalies appear in the CloudTrail console
- • Event is sent to Amazon S3
- • An EventBridge event is generated (for automation needs)
CloudTrail Events Retention
• Events are stored for 90 days in CloudTrail
• To keep events beyond this period, log them to S3 and use Athena

AWS X-Ray – Visual debugging for distributed system better than old way of debugging
- Debugging in Production, the good old way:
- Test locally
- Add log statements everywhere
- Re-deploy in production
- Log formats differ across applications and log analysis is hard.
- Debugging: one big monolith “easy”, distributed services “hard”
- No common views of your entire architecture
- Enter… AWS X-Ray!
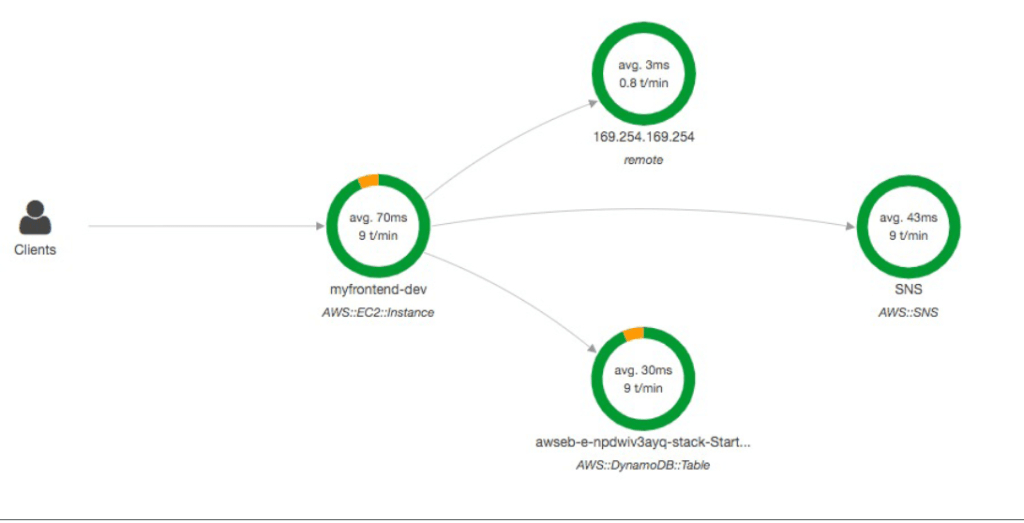
AWS X-Ray advantages
- • Troubleshooting performance (bottlenecks)
- • Understand dependencies in a microservice architecture
- • Pinpoint service issues
- • Review request behavior
- • Find errors and exceptions
- • Are we meeting time SLA?
- • Where I am throttled?
- • Identify users that are impacted
Amazon CodeGuru
An ML-powered service for automated code reviews and application
performance recommendations
Provides two functionalities
- CodeGuru Reviewer: automated code reviews for static code analysis (development)
- CodeGuru Profiler: visibility/recommendations about application performance during runtime (production)
Amazon CodeGuru Reviewer
- Identify critical issues, security vulnerabilities, and hard-to-find bugs
- Example: common coding best practices, resource leaks, security detection, input validation
- Uses Machine Learning and automated reasoning
- Hard-learned lessons across millions of code reviews on 1000s of open-source and Amazon repositories
- Supports Java and Python
- Integrates with GitHub, Bitbucket, and AWS Code-commit
Amazon CodeGuru Profiler
- • Helps understand the runtime behavior of your application
- • Example: identify if your application is consuming excessive CPU capacity on a logging routine
- • Features:
- • Identify and remove code inefficiencies
- • Improve application performance (e.g., reduce CPU utilization)
- • Decrease compute costs
- • Provides heap summary (identify which objects using up memory)
- • Anomaly Detection
- • Support applications running on AWS or on-premise
- • Minimal overhead on application
AWS Status – Service Health Dashboard
- Shows all regions, all services health
- Shows historical information for each day
- Has an RSS feed you can subscribe to
AWS Personal Health Dashboard
- AWS Personal Health Dashboard provides alerts and remediation guidance when AWS is experiencing events that may impact you.
- • While the Service Health Dashboard displays the general status ofAWS services, Personal Health Dashboard gives you a personalized view into the performance and availability of the AWS services underlying your AWS resources.
- • The dashboard displays relevant and timely information to help you manage events in progress and provides proactive notification to help you plan for scheduled activities.
Summary
- AWS CloudWatch – CloudWatch collects monitoring and operational data in the form of logs, metrics, and events, providing you with a unified view of AWS resources, applications, and services that run on AWS and on-premises servers. You can analyze the logs and identify the reason behind the slowness or unavailability of your website
- AWS CloudTrail – CloudTrail provides the event history of your AWS account activity, including actions taken through the AWS Management Console, AWS SDKs, command-line tools, and other AWS services
- AWS Organizations – It helps you centrally govern your environment by including multiple AWS accounts as you grow and scale your workloads on AWS. You can also simplify billing by setting up a single payment method for all of your AWS accounts within your organization
- AWS AppConfig – Use AWS AppConfig, a capability of the AWS Systems Manager, to create, manage, and quickly deploy application configurations. AppConfig supports controlled deployments to applications of any size and includes built-in validation checks and monitoring
